🖌️ Visualization of surfaces and curves
With this small project, you can learn how to visualize surfaces and curves in three-dimensions using Python.
Before start
Install Python and learn basic skill of it.
Python is a very (probably the most) useful programming language for general purpose programming. You’d better learn it ASAP if you want to keep up-to-date.
Steps
Step #1
Install numpy, matplotlib packages for your Python using command
$ pip install numpy
$ pip install matplotlib
If these packages are already installed in your computer (which is the case mostly), you can jump to the next step.
Step #2
Download the Python scripts to be used by clicking on:
You will see the following functions in these scripts. Study the scripts carefully to learn how to use them to plot curves or surfaces.
Plot a curve in three-dimensions.
- curve.curve(x, y, z, t_range)[source]
Plot a curve in three-dimensions.
- Parameters:
x – the
 parametric function.
y – the
 parametric function.
z – the
 parametric function.
t_range – the range of the parameter
 .
.
Plot a surface in three-dimensions.
- surface.surface(z, x_range, y_range)[source]
Plot a surface in three-dimensions.
- Parameters:
z –
The function that represents the surface.
- If you have the equation of the figure in the form

You should first re-write it into the form

x_range – The range of
 -coordinates.
y_range – The range of
 -coordinates.
Step #3
Once you understand how these scripts work, you can use them to visualize
the surface
 in the range of
 ![x\in[0,2]](../../../../_images/math/7b76fb165c453ab52d82dc4bbb839c2491c0ded2.svg) and
and ![y\in[0,0.5]](../../../../_images/math/13101dc64a68e367cdd211ffcb94b91ab338963f.svg) ,
,the curve
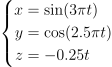 in the range of
 ![t\in[0,2]](../../../../_images/math/e084ac5d801697814c9400ea092808343871b80d.svg) .
.
If you can show me pictures of them in time, you will receive a PLUS for the general grade.
Happy coding.
↩️ Back to 🧩 Workshop.
🏠️ Back to Math is cheap.